image = np.loadtxt('BYGS008_top_segment_500samp_10cm_interp089.txt')Examples
When working with raster data we generally want to perform the following workflow: 1. Remove the best fit plane and normalize the data 2. Remove the underlying form by fitting a Degree 3 Polynomial 3. Apply a high frequency gaussian filter to attenuate noise 4. Generate our rotational profiles and sections 5. Calculate our parameters. 6. Analyze the data.
First let’s get some data
Let’s have a look
plt.imshow(image)
plt.show()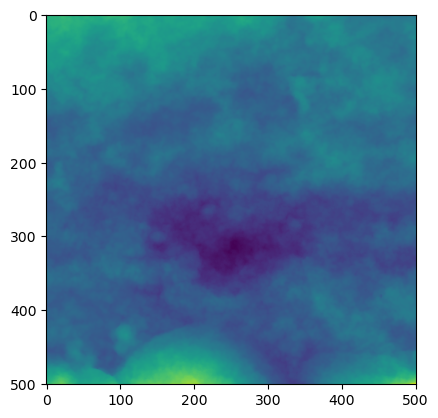
Okay now let’s process it.
levelled_image     = plane_level(image)
remove_form_image  = remove_form(levelled_image)

data     = smooth_image(remove_form_image)
sections = gen_sections(data)
profiles = gen_rot_prof(data)
(data.shape,sections.shape,profiles.shape)
NameError: name 'plane_level' is not definedOur processed datta should look a little different.
plt.imshow(data)
plt.show()
Looks good, let’s get our profile parameters. We’ll use the default settings, so our profiles move down the ‘rows’ of the image/array/raster. We’ll also generate our rotational profiles and parameters.
image_ra = Ra(image)
image_rms = Rms(image)
rotational_profiles= gen_rot_prof(image)
image_rot_ra = Ra(rotational_profiles)
image_rot_rms = Rms(rotational_profiles)
Let’s visualise them. First we’ll make some boxplots to look at the distribution and find any outliers
plt.figure()
plt.subplot(221)
plt.boxplot(image_ra)
plt.title('Image Ra')

plt.subplot(222)
plt.boxplot(image_rms)
plt.title('Image Rms')

plt.subplot(223)
plt.boxplot(image_rot_ra)
plt.title('Image Rotational Ra')

plt.subplot(224)
plt.boxplot(image_rot_rms)
plt.title('Image Rotational Rms')
plt.tight_layout()
Let’s try a scatter plot, Ra/Rms against location of the profile and rotational Ra/Rms against degree
plt.figure()

plt.subplot(221)
plt.scatter(range(len(image_ra)),image_ra)
plt.title('Image Ra')

plt.subplot(222)
plt.scatter(range(len(image_rms)),image_rms)
plt.title('Image Rms')

plt.subplot(223)
plt.scatter(range(len(image_rot_ra)),image_rot_ra)
plt.title('Image Rotational Ra')

plt.subplot(224)
plt.scatter(range(len(image_rot_rms)),image_rot_rms)
plt.title('Image Rotational Rms')
plt.tight_layout()
How about plotting Ra against Rms?
plt.figure()
plt.subplot(121)
plt.scatter(image_ra,image_rms)
plt.title('Image Ra/Rms')

plt.subplot(122)
plt.scatter(image_rot_ra,image_rot_rms)
plt.title('Image Rotational Ra/Rms')

plt.tight_layout()